Terahertz Ltd.
Context: Terahertz is a thriving business which offers a vast array of products from different categories. However, sales have started to ramp up across de country, and managing all the data is getting more complex by the day.
Objective: Optimize and automate data ingestion using Power Pivot and Excel as our main tools.
Loading the data into Power Query
Data Cleansing
We apply EDA(exploratory data analysis) and then, make sure that every single data source is correctly loaded and transformed within Power Query, assuring that the relevant data will be part of the final model (including our self updating calendar table).
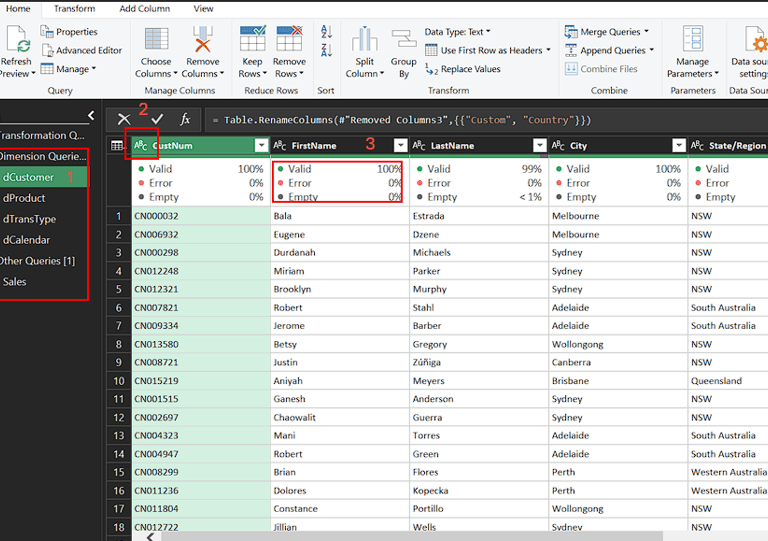
We perform data validation and cleaning by checking for but not limited to:
Null values.
Invalid data types.
Incorrect regional settings.
Incorrect date formats.
Outdated data, etc.
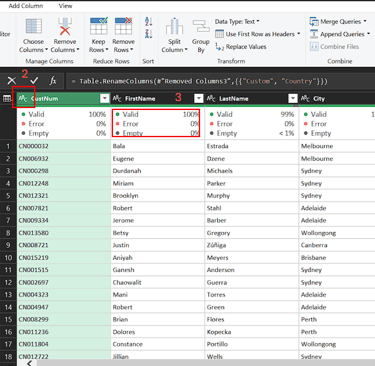
We check for column quality by considering the valid, errors and empty cells of each field of every table to double check the validity of our cleansing process.
Data Wrangling
Structuring the relational model
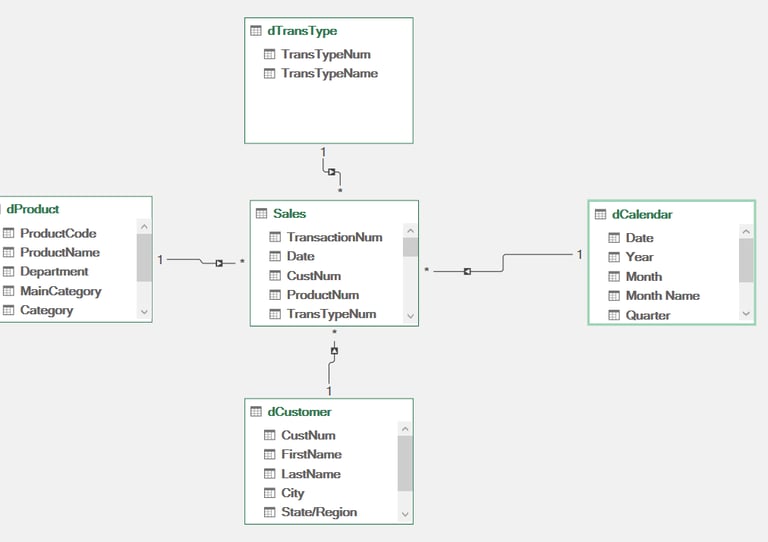
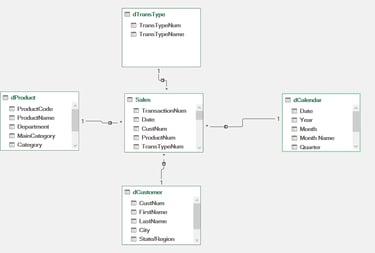
Applying the star-type relational model, we configure the relationships between our multiple dimension tables and our fact table (sales).
We check that the calendar table is configured as our main date table and that it self updates when new data is inserted into our data model.
We create explicit measures for our main KPIs using DAX.
Note: Dealing with hundreds of thousands of records and even millions of records, is incredibly efficient by applying our relational model through Power Query and Power Pivot, since none of the "real" data is loaded inside our main workbook, but only a compressed, highly efficient version of it.
Data Visualization (Excel)
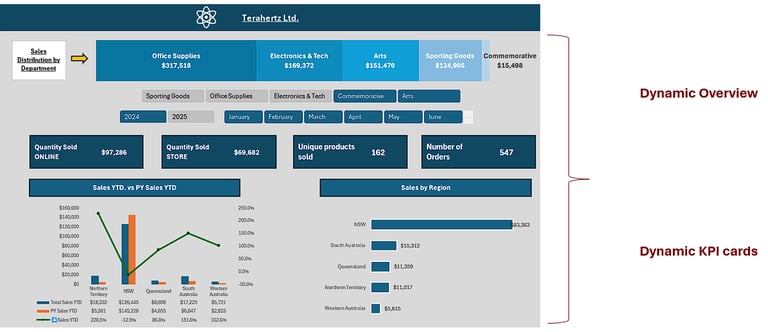
Notes: Certain filters have been restricted from affecting visualizations such as the Sales YTD vs. PY Sales YTD, making it easier to slice the rest of the data without missing out on key metrics that do not need to be filtered!
Key techniques applied: DAX, Time intelligence formulas, Cube formulas, Dynamic calendar table creation with Power Query, Relationship Management with Power Pivot.
NSW is our most important market by quite some margin.
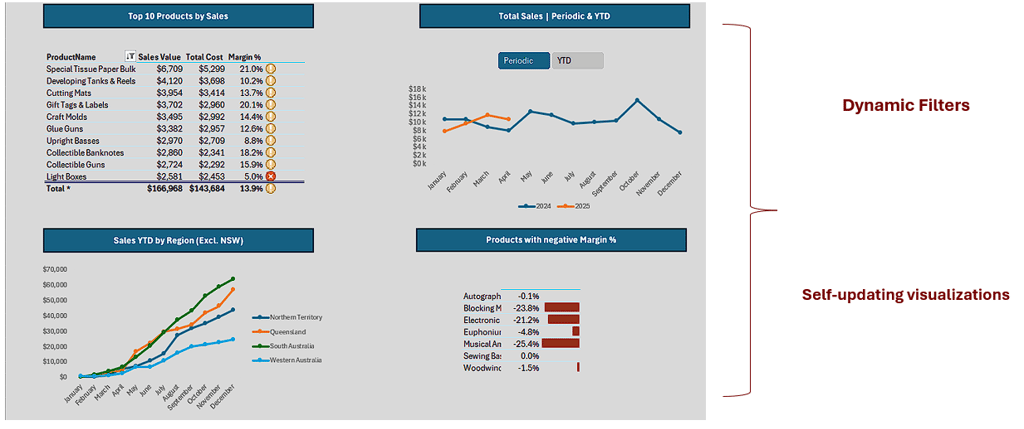
Commemorative is our most vulnerable department (less than 2% of total sales).
Electronics has the most amount of products (5) with negative margin.
Sales in 2025 are promising so far but our biggest market has suffered a decline (-12.9% vs. last year) and further investigation is needed.
Our profit margin is healthy (over 20% in most cases) across the board. However, there are still some outliers (such as light boxes - 5%) that need to be inspected more closely.
💡Insights & Questions ⁉️
Next steps
What did we find?
Could we make strategic alliances with local businesses or digital marketplaces to strengthen our position in the rest of the markets? (Excl. NSW).
Can we establish better offers to increase our commemorative sales?
What about performance based-incentives only for certain departments to boost sales?
Can we bundle our top performing electronic products with those that are not doing well to clear inventory first?
Does it make sense to keep all of our products as part of the portfolio in the long run?