
Blue Tech Ltd.
Context: Blue Tech Ltd. is a company that sells a wide arrange of technologically advanced products around the world. With hundreds of thousands of transactions registered per year, its database size is increasing rapidly, making analysis more complex and leaving certain tools outdated due to the sheer volume of data that needs to be accounted for.
Objective: Uncover patterns and trends by applying time intelligence and customer behavior techniques, by extracting data using SQL(Structured Query Language) as our main tool.
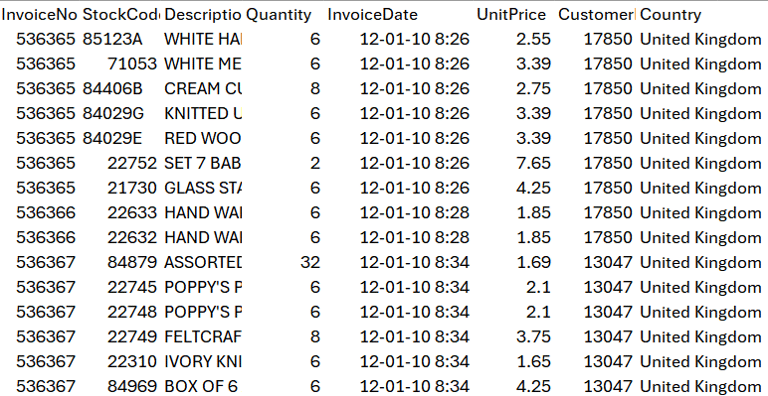
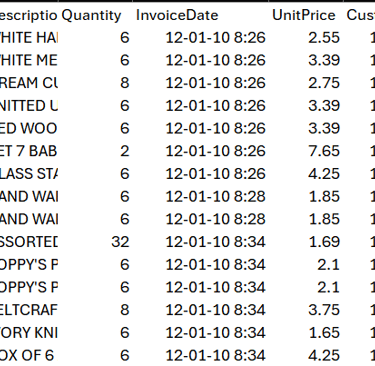
Data Source
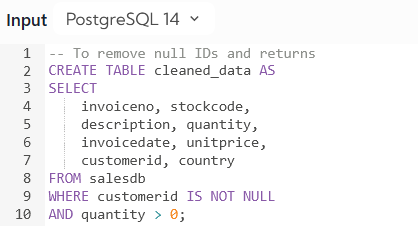
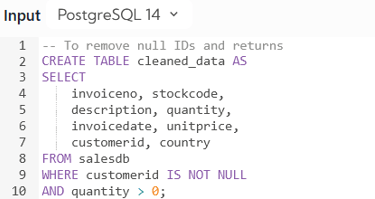
Data Preparation
Churn Analysis
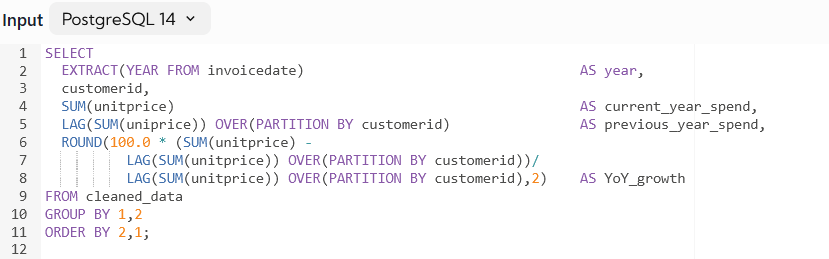
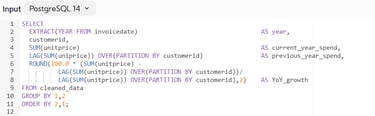
To spot trends over certain periods of time we can perform time series analysis over a dataset, and one way to measure the impact of certain business decisions over time is measuring the Year-Over-Year Growth, due too its deep impact on long term strategic decision making.
Thus, the following query will allow us to obtain the amount spent by each customer over multiple years, while also calculating the percentage change between each of those periods.
Generating the new cleaned table
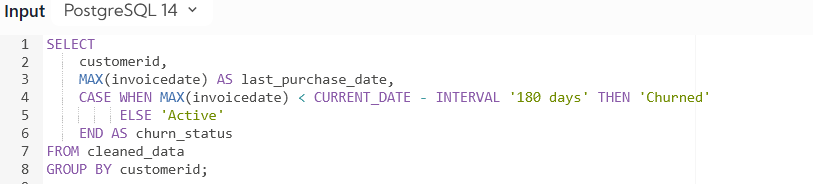
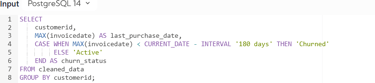
Churn analysis reveals factors driving customer attrition, helping businesses boost retention, enhance experiences, and drive growth. The first query is the simplest approach to categorize if a customer is either active or churned. However, we can also apply a CTE (Common Table Expression), to obtain the total number or even the percentage of churn and active customers.

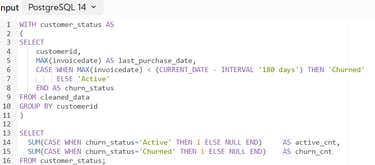
Using a CTE
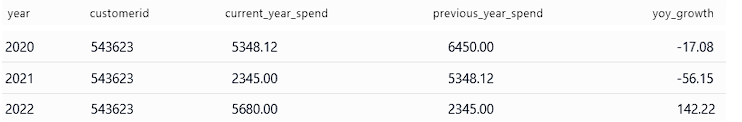
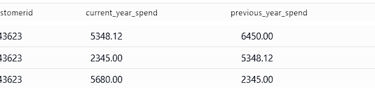
YoY Analysis
Cohort Analysis
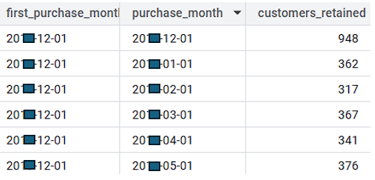
Cohort analysis groups customers by shared traits over time, uncovering trends that drive retention, engagement, and growth.
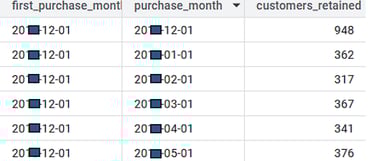
The following query will allow us to gain insights into how many customers have Blue Tech been able to retain over certain period of time.

Result
Sample result


Sample Result
* EDA and quality control process to ensure data accuracy by checking for: null values, invalid data types, incorrect date formats, outdated data, duplicated data, etc.
Out of all of our clients, only 3% are considered "churned" (have not acquired products for the past 6 months). Which is a healthy number, that can definitely be improved.
Historically, Blue Tech customers spent less during 2020 and 2021. With a strong comeback in sales during 2022.
We found out that approximately 1/3 of our customer base make recurrent purchases (month after month) after its first purchase, over a 6 month period.
💡Insights & Questions ⁉️
Next steps
What did we find?
Blue Tech should implement personalized win-back campaigns, loyalty and engagement strategies and also, now that we have information about clients, be more proactive in order to further decrease the number of churned clients over time.
Was the 2020 to 2022 customer behavior solely caused by the pandemic? Are there any underlying causes, such as logistic delays on Blue Tech's side that could have negatively impacted sales as well?
To address customer retention, can Blue Tech further refine the personalized recommendations that arrive via ads or email to boost recurrent sales?
And this is just the tip of the iceberg 🧊
Much more insights are waiting to be uncovered by asking the right questions!